Axione - a major player in smart infrastructure - operates multiple IoT solutions through the IOThink platform, covering domains such as air quality, smart parking, waste management, and environmental monitoring.
.png)

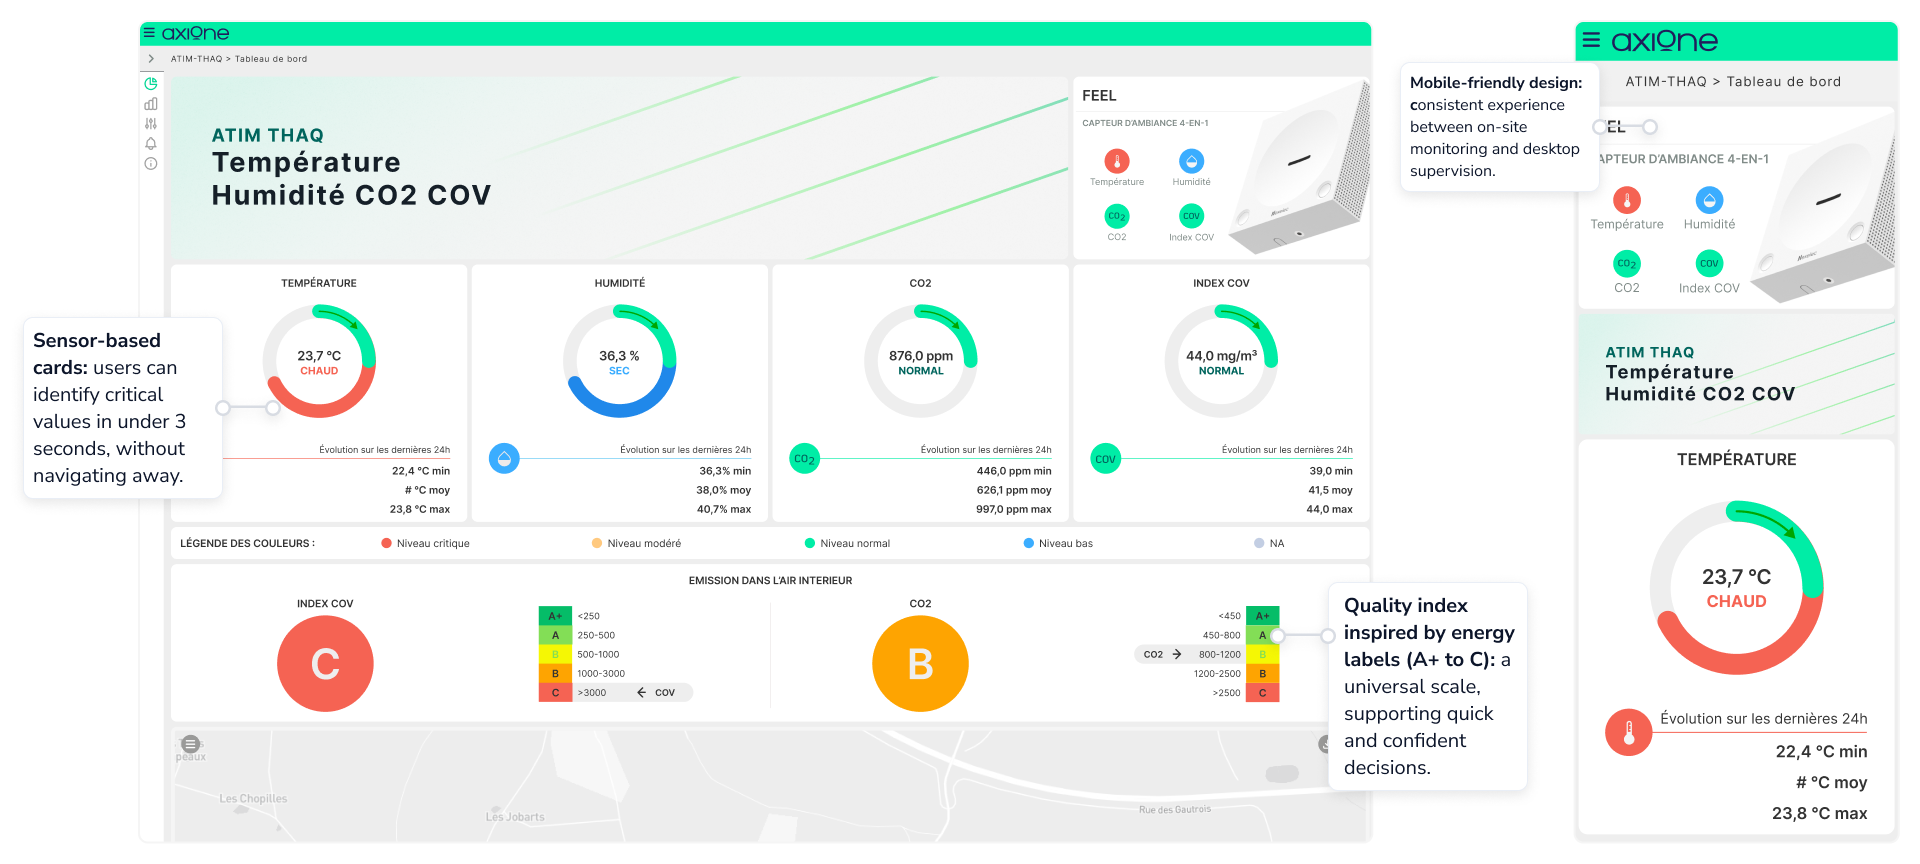
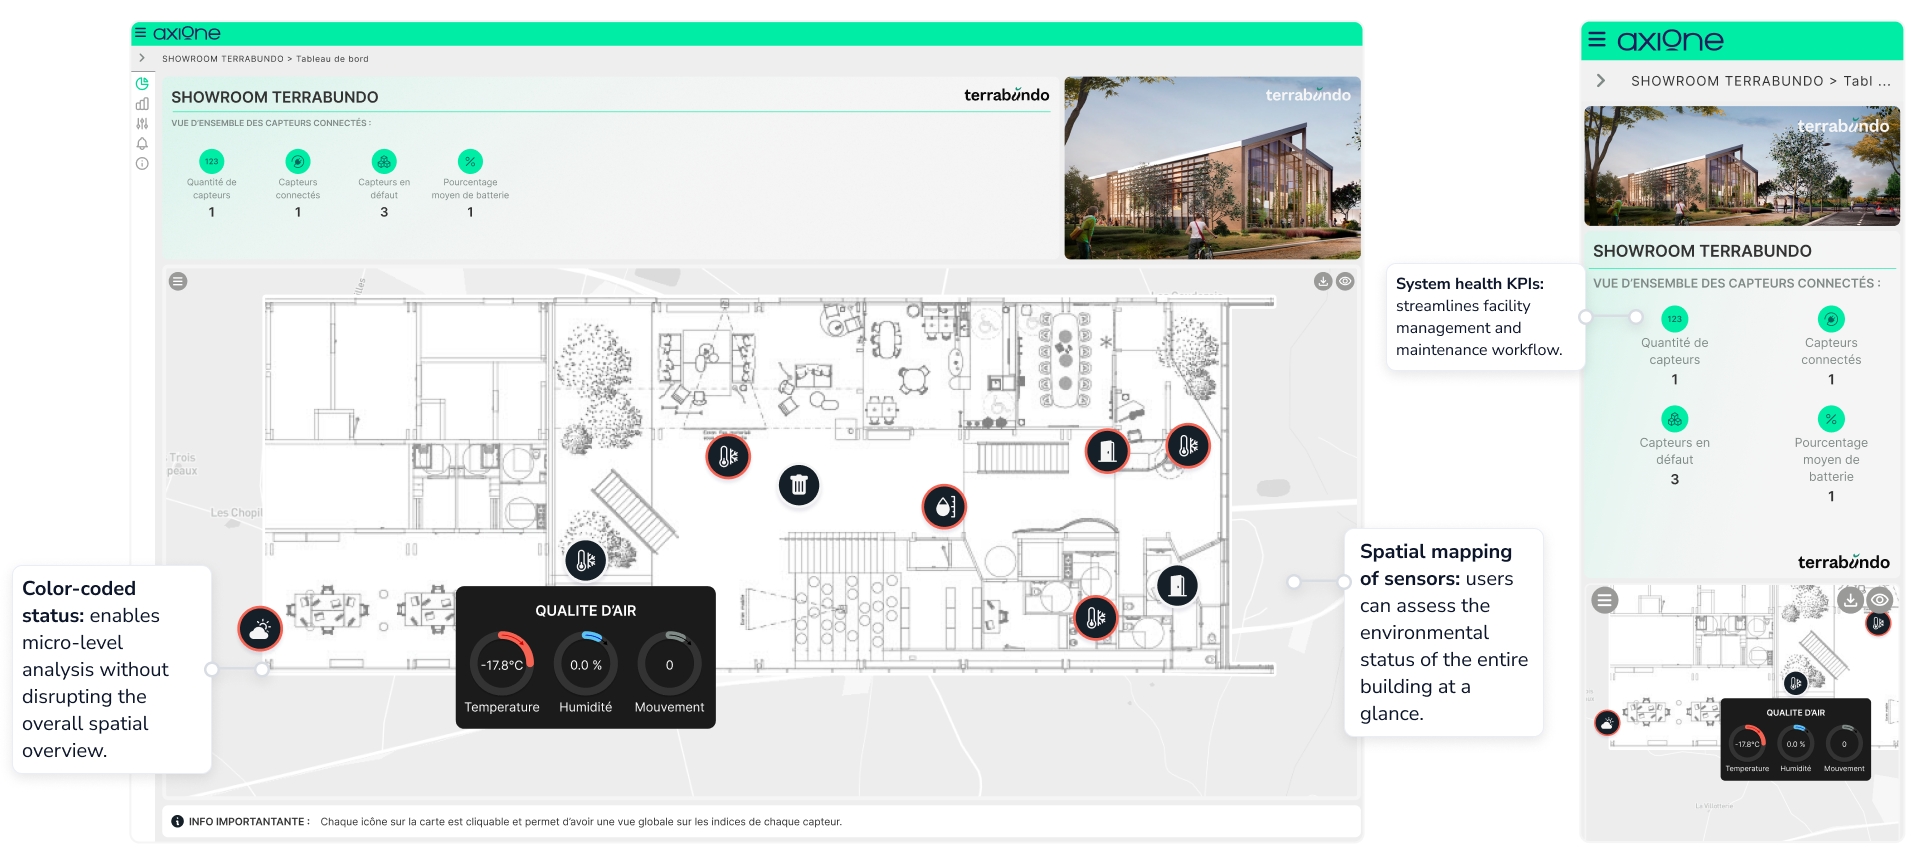
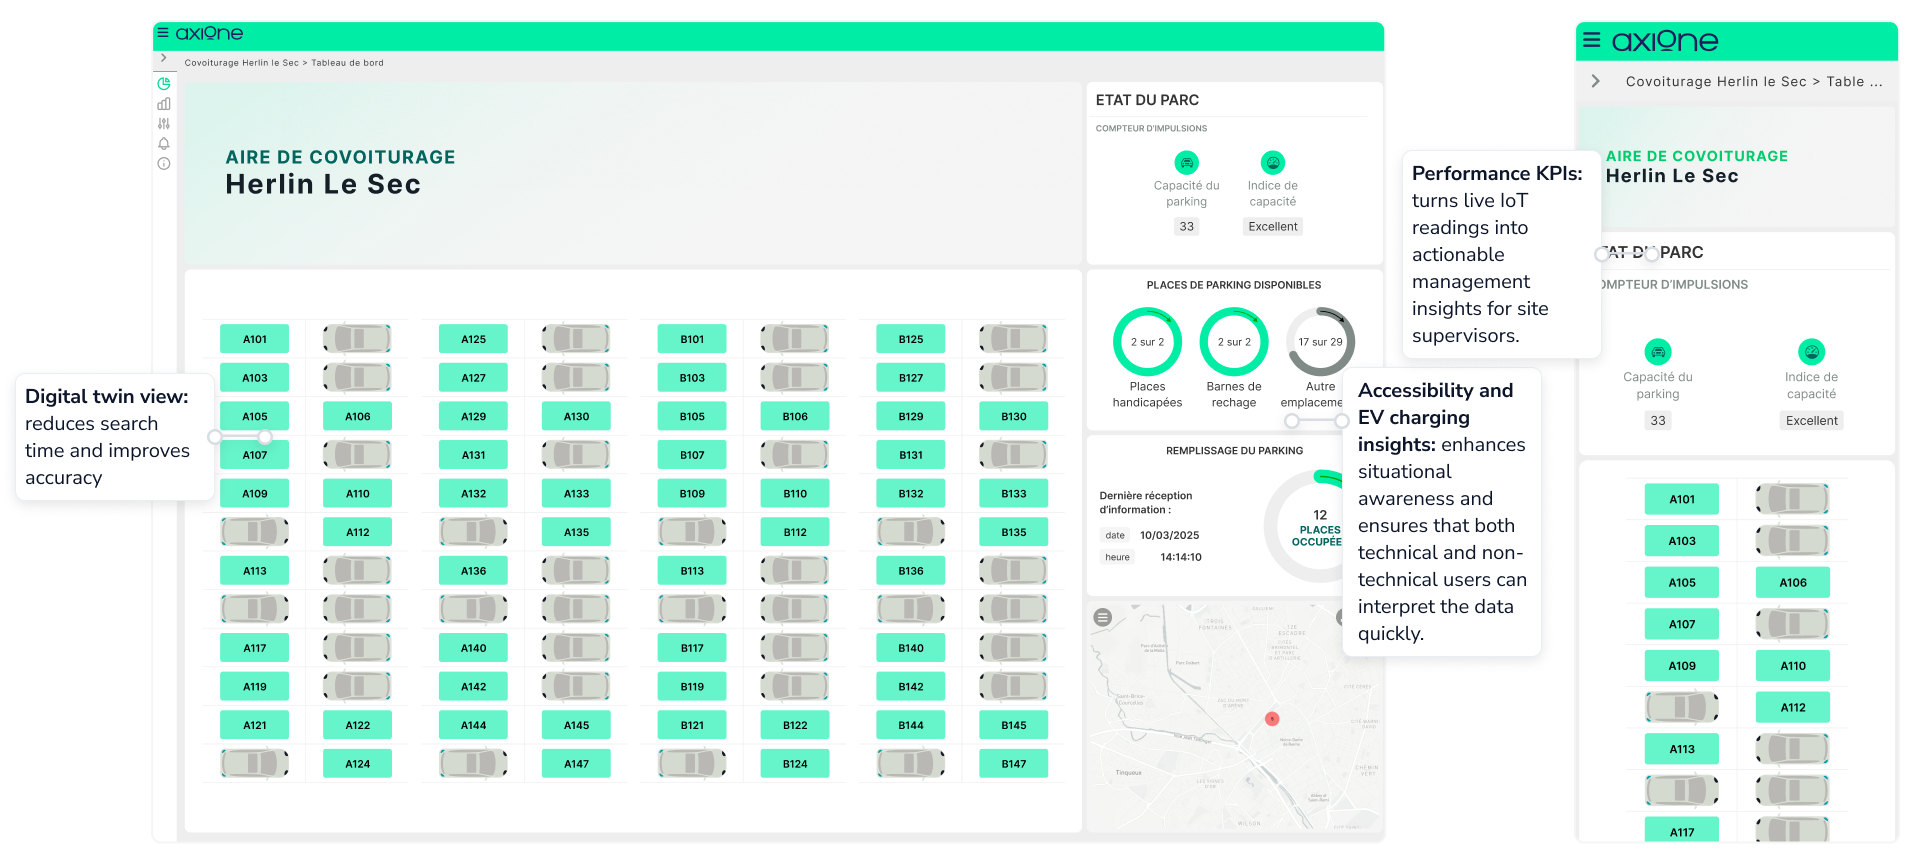
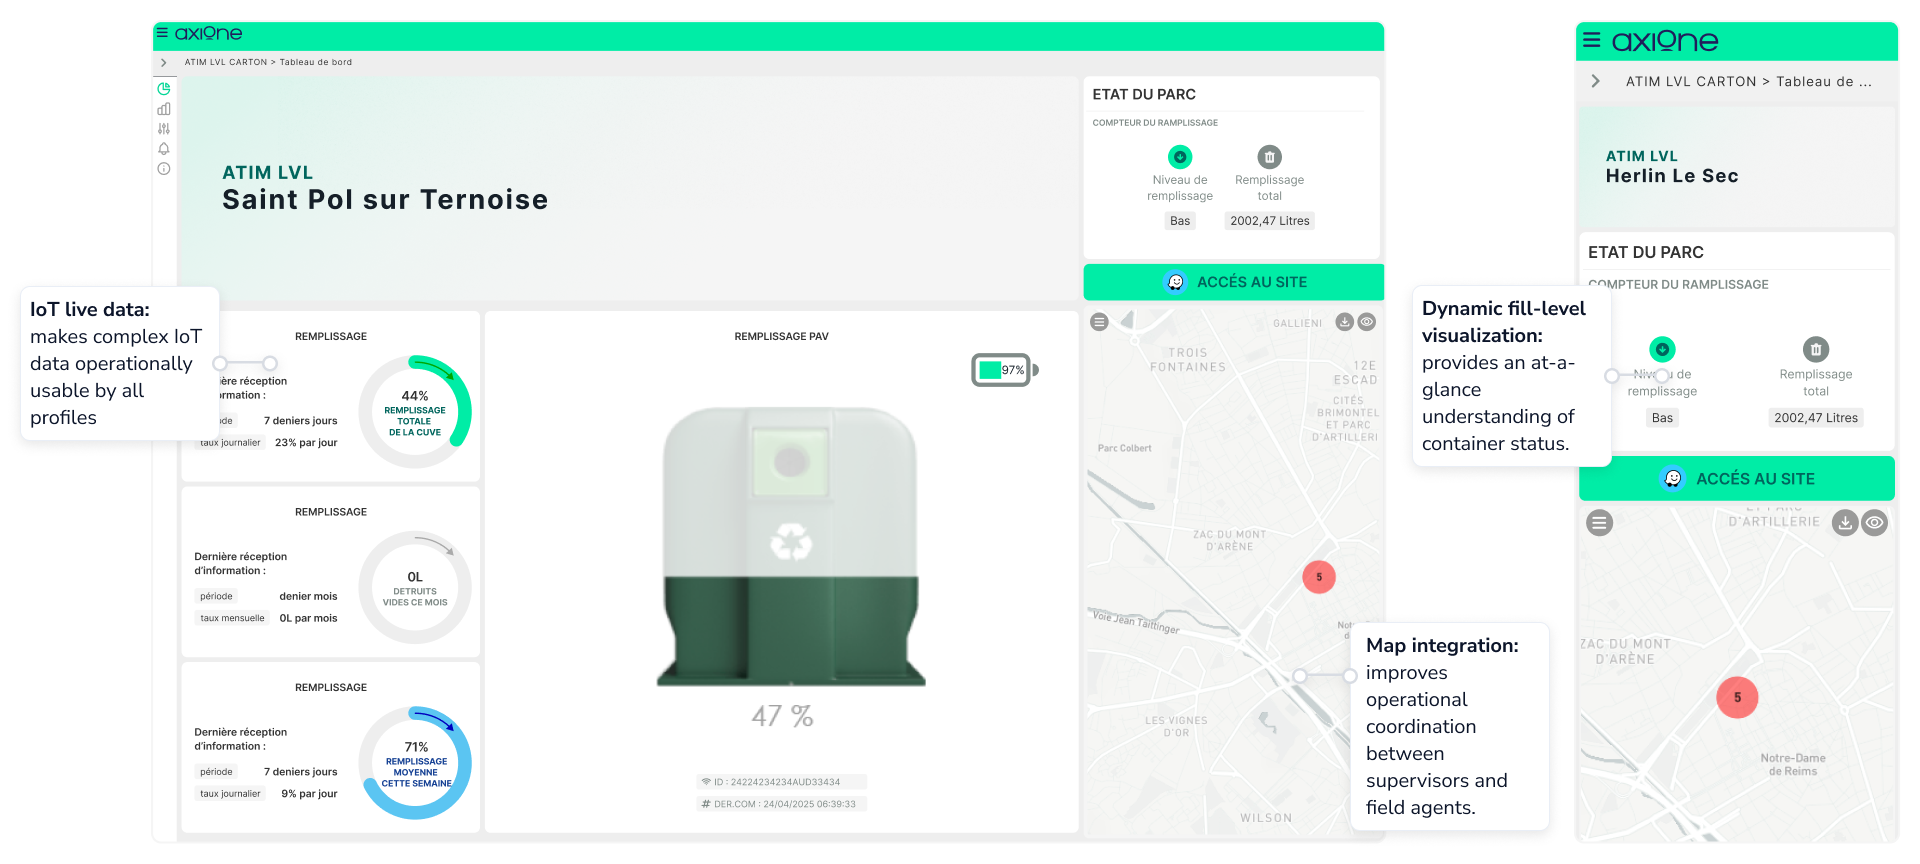
Axione’s IoT ecosystem connects sensors across smart cities, buildings, and environmental infrastructures.The original platform - built on IOThink technology - was powerful but complex to navigate, especially for non-technical users.

Transform a highly technical tool into a clear, scalable, and human-centered experience.

Multi-profile audience: designing for both technical users (engineers, maintenance) and non-technical ones (city operators, managers).
Fragmented user experience: multiple dashboards built independently, each with different UI logic and terminology.
Scalability: ensuring one design system could adapt to different IoT domains — air quality, waste, mobility, building management.
The redesign of Axione’s IoT platform was guided by a business- and collaboration-oriented approach, focusing on enterprise needs, platform constraints, and technical feasibility rather than traditional end-user testing.The process combined strategic alignment, co-creation, and cross-functional teamwork to ensure the new design was both realistic and impactful.

Unified design system: created a modular and scalable design language adaptable across multiple IoT applications.
- Technical and visual limitations: the existing platform architecture restricted layout flexibility.
- No direct user research: due to internal project constraints, the redesign had to rely on business needs and stakeholder input, not on formal user testing.
A unified IoT platform that transforms complex datasets into intuitive visual dashboards, improving efficiency, awareness, and user confidence across the entire smart city ecosystem.
I design experiences that feel natural, seamless, and crafted with intention - so your product connects effortlessly with your audience.

